BY ALEX CHAPMAN, JASMEET PHAGOORA
Many people in Britain have no choice but to travel to get safe access to green space.
When Boris Johnson rode out across London during lockdown, reportedly cycling seven miles from his home, he drew some criticism for not following the spirit of the lockdown rules. But we should exercise caution before jumping to condemn long bike rides. With green, open, public spaces now one of the few places that we can visit outdoors, it’s time to look at why some of us have to travel to get safe access to green space.
In our analysis for Natural England’s new People and Nature survey, we found that 42% of British people believe that visiting local green and natural spaces like parks and beaches has become even more important to their wellbeing since the pandemic began. The trouble is, the same analysis shows that around 40% of the population are concerned about overcrowding and not being able to keep their distance from others. Also worrying, is that around one in eight people (12.5%) don’t believe that their local green space is of a high enough standard to want to spend time in. The reality is, travelling seven miles may be the only way for some people to get safe access to good quality green space – vital to their mental and physical wellbeing.
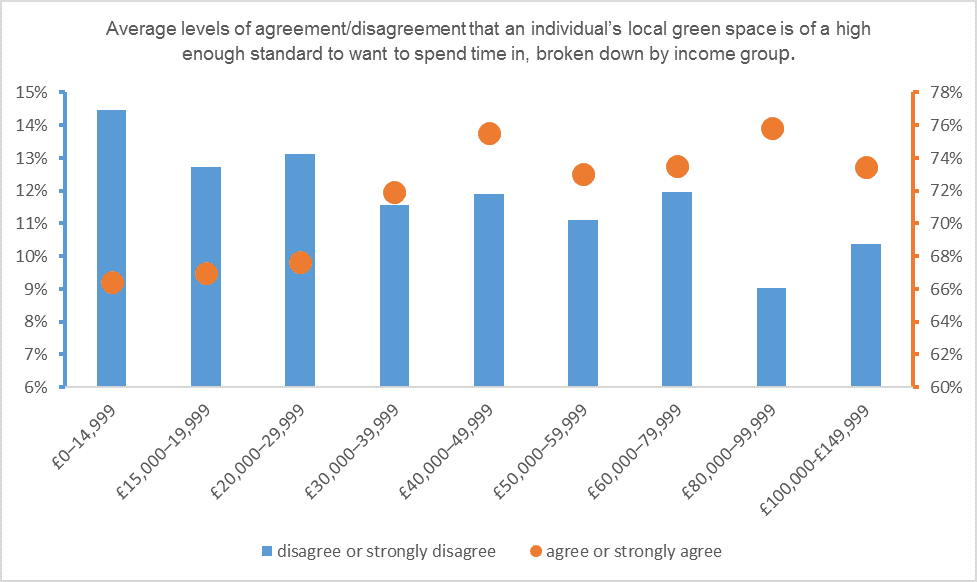
As our analysis from last year found, engagement with green space during the pandemic has not been uniform across regions and demographic groups. And as usual, it’s the poorest communities who lack access to adequate green space. During the peak of the first wave, the number of people visiting green spaces in poorer areas dropped more than in wealthier areas. We know that green spaces’ quality, size, and proximity to residents’ homes differ between poorer and wealthier areas, and people on lower incomes report greater dissatisfaction with the quality of their green space (see Figure 1).
Figure 1: People with lower incomes are more likely to report dissatisfaction with the quality of their green space.
We are calling the experience of living both on low incomes and with inadequate green space provision ‘green deprivation’. And the importance of tackling green deprivation grows by the day. The longer the pandemic continues, the greater the public health impacts of the lockdown. Reduced physical activity and increased mental health strain, both of which can be partially mitigated by access to high-quality green space, will ultimately damage wellbeing and increase pressure on the NHS – at a time when the health service is already stretched to breaking point.
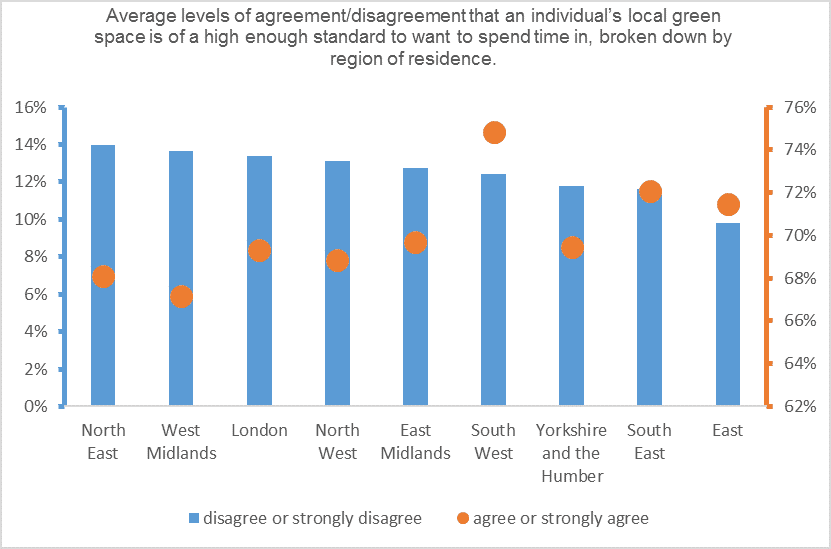
Tackling green deprivation is not a one-size-fits all job, it requires a detailed understanding of place. Perceptions of green space provision vary between regions. Our analysis has suggested that the north-east and West Midlands have somewhat worse provision that other English regions. London also does badly on some metrics (see Figure 2). But even looking at the regional level is still far too broad to understand barriers to green space access in local neighbourhoods.
Figure 2: The West Midlands and north-east show greater levels of dissatisfaction with the quality of green space provision than the east and south-east.

To dig into the detail, we worked with West Midlands Combined Authority to take a precise look at the phenomenon of green deprivation. Using a composite scale, which links the Index of Multiple Deprivation to data on green space provision from the Office for National Statistics (ONS), we developed a useful method for mapping green space deprivation at the local level.
As shown in Figure 3, we were able to identify local areas in the West Midlands where people are living with both low income and poor green space provision. We found that green deprivation shows up particularly in inner city areas of Birmingham and Coventry, and parts of Dudley, Sandwell, Walsall and Wolverhampton. Our analysis is still quantitative and ‘top down’, so it can only tell us so much about the everyday experiences of people from different walks of life, and how they experience green deprivation. But we have already started looking at how poor green space provision links to things like a high prevalence of elderly people or ethnic minority groups (more about this in future blogs). The analysis in Figure 3 also only measures green space access by size rather than quality, but this is another gap we hope to fill in upcoming work.
Figure 3: Many areas of the West Midlands Combined Authority are in the 20% of UK areas worst affected by ‘green deprivation’, notably, inner city areas of Birmingham and Coventry, and parts of Dudley, Sandwell, Walsall and Wolverhampton
A composite index of the Index of Multiple Deprivation and the provision of green space (m2 per person) at the Lower Super Output Area (LSOA) level. Areas are ranked nationally and broken down into highest levels (1st-20th percentiles), moderate levels (21st-80th percentiles), and lowest levels (81st-100th percentiles) of green deprivation.

Sources: NEF analysis of multiple ONS sources
We hope that our analysis will support West Midlands Combined Authority, along with their constituent local authorities, to take action on alleviating green deprivation with targeted programmes in the right areas. However, they still face significant barriers — not least, a lack of funding. To-date the government has put no significant funding behind green space expansion, with just relatively small sums to tree planting and other green projects. With the climate and ecological crises escalating, the need to kick-start the flagging economy, and the UK’s communities in desperate need of more and better quality local green spaces, now is the time to act. A significant fiscal stimulus dedicating new investment to green infrastructure projects, some of which should expand green space provision, would be a good starting point.
